













Skip to content

Pharma commercial excellence

Connect commercial execution to incremental sales.

Understand how HCP coverage and call frequency affect sales in each area and specialty. Tune who you reach and how often you call to maximize incremental sales.

Activity Optimizer · Planning overview
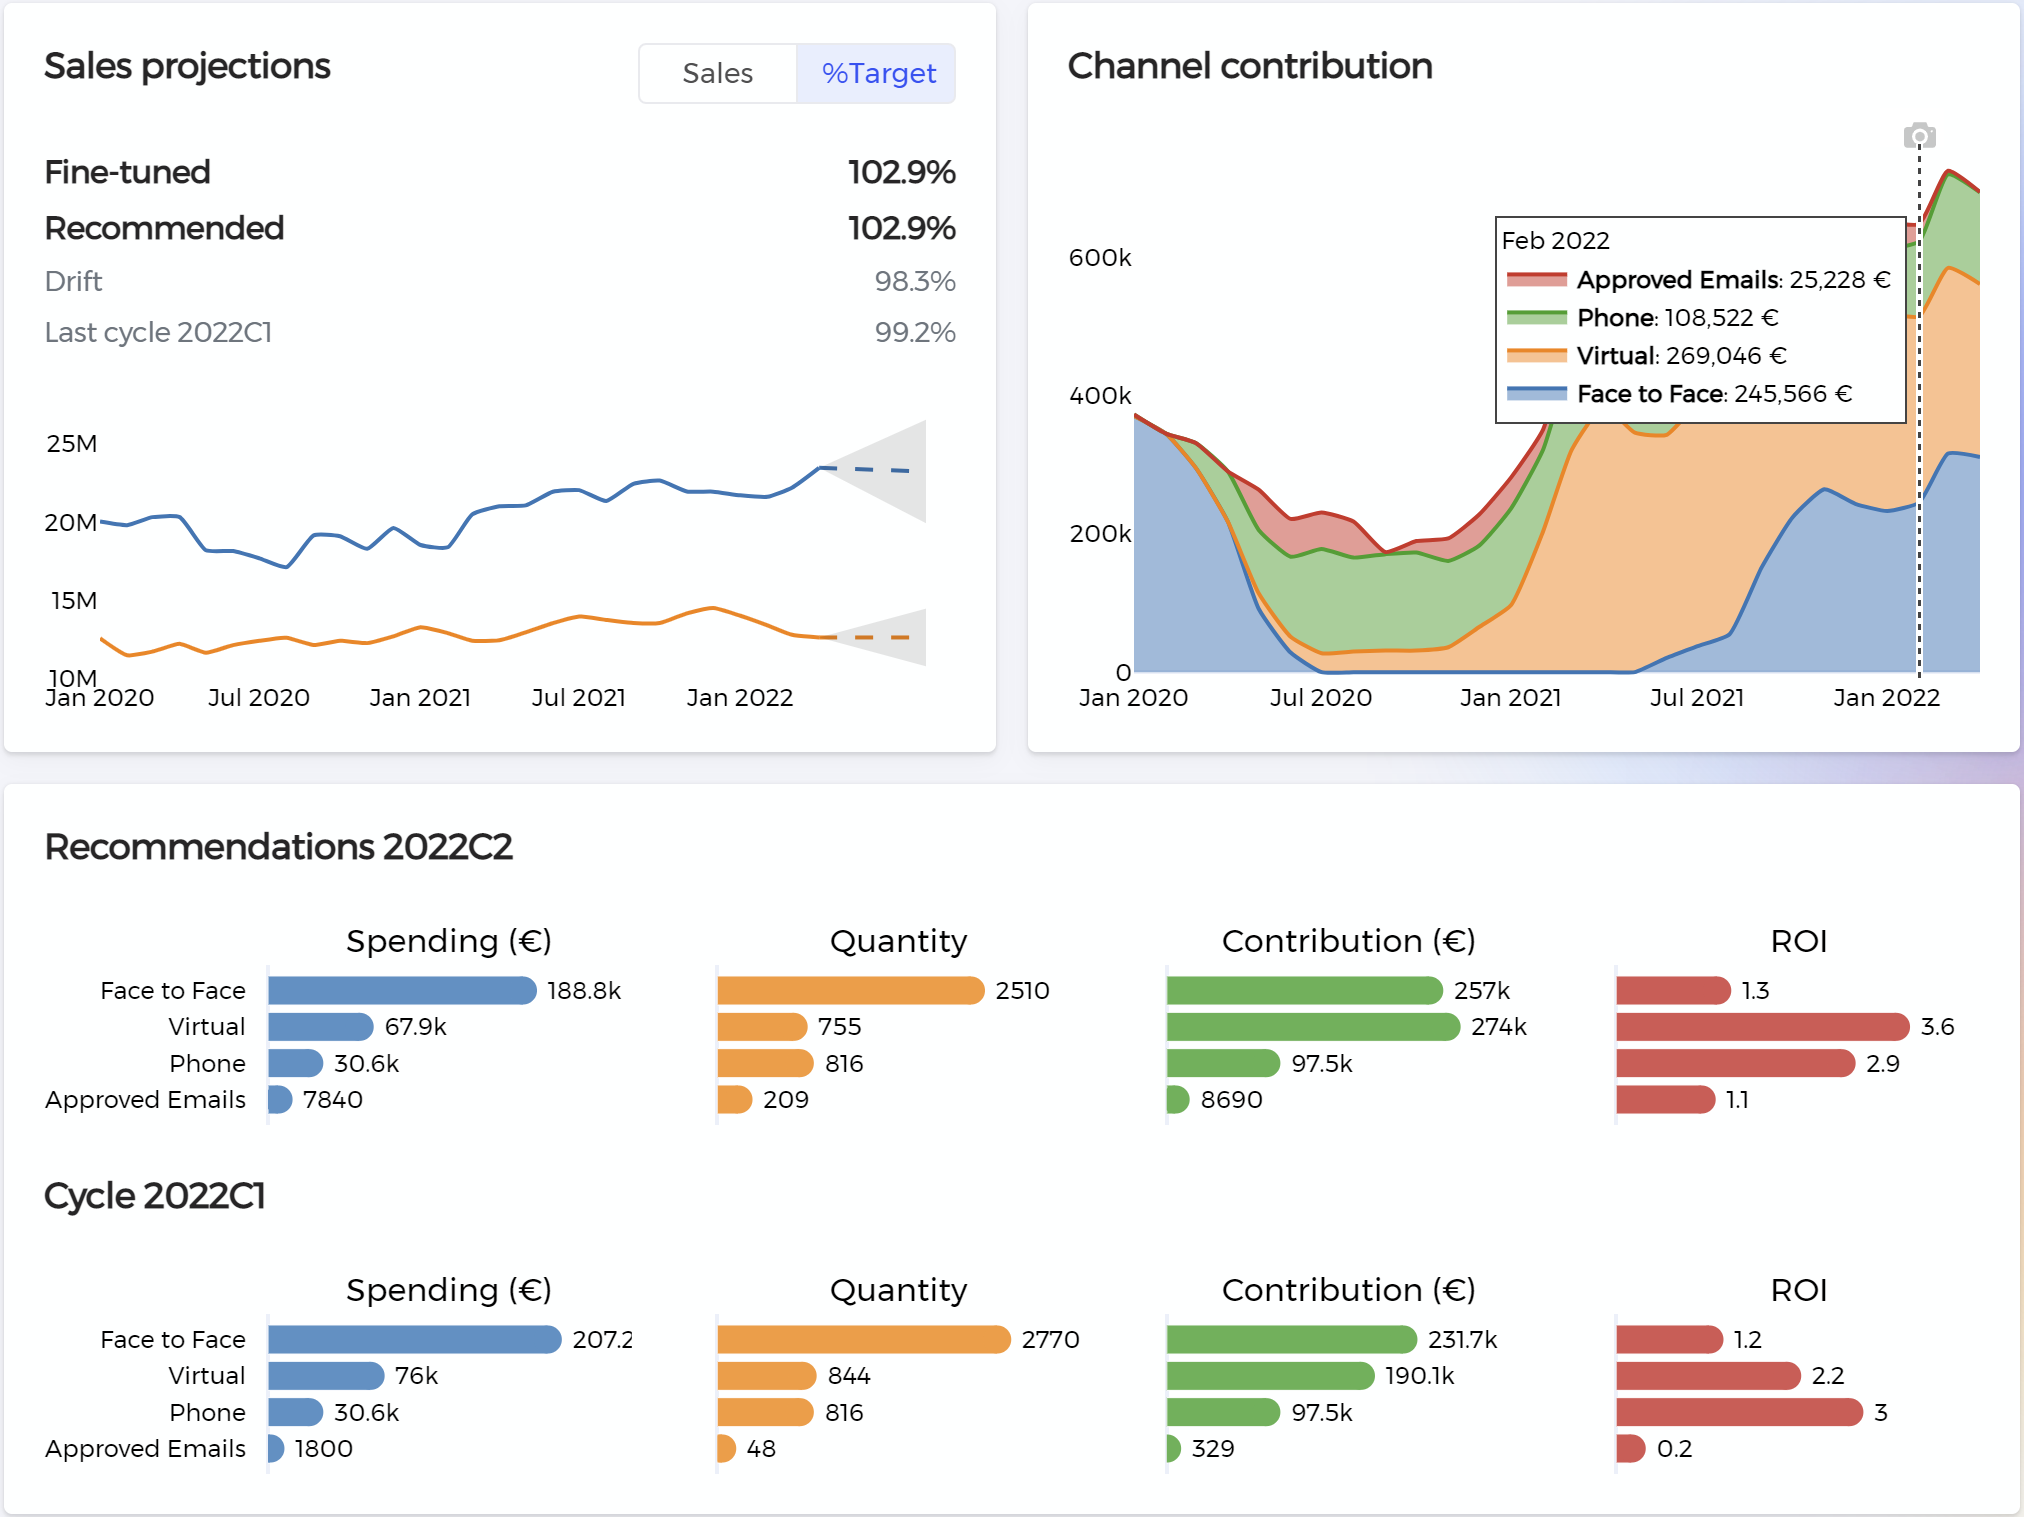
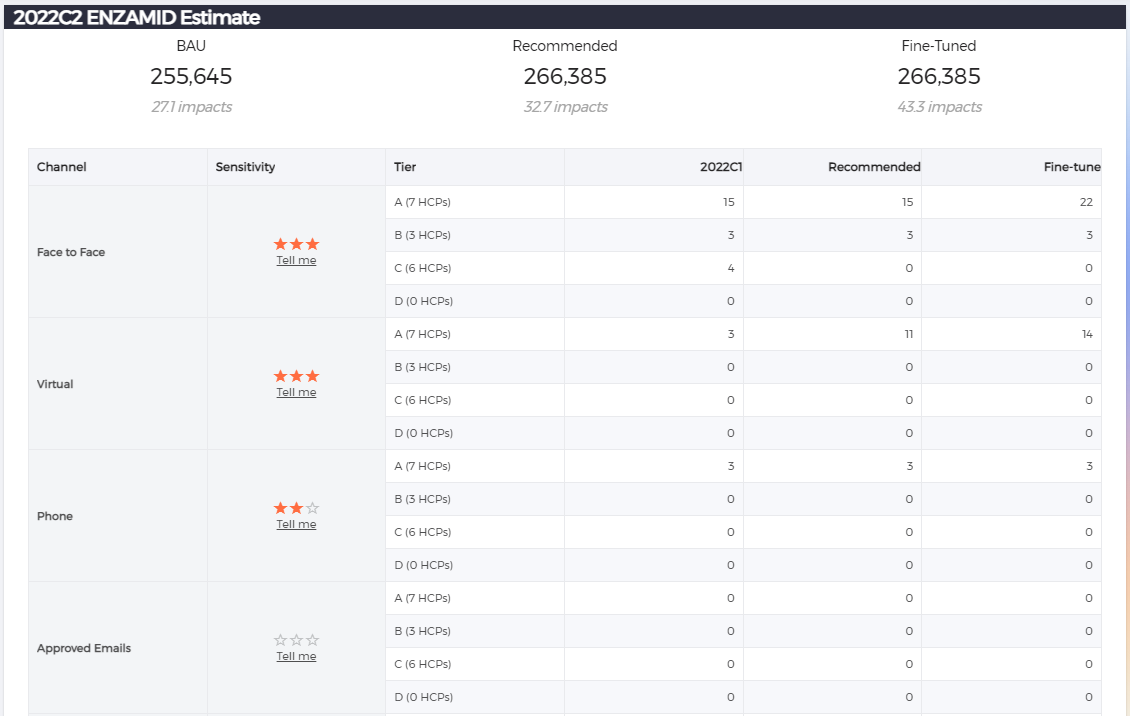
Activity Optimizer · Planning overview. Sales projections, channel contribution and recommended activity compared with the previous cycle.

Sales projections, channel contribution and recommended activity compared with the previous cycle.

View full-size screen (opens in a new tab)

Customer result · Oncology 2 · Spain

+€185kincremental sales per territory

AI call-plan territories compared with business as usual.

View customer results

Trusted by pharma teams worldwide

Alexion
AstraZeneca
Bristol Myers Squibb
CSL Vifor
Daiichi-Sankyo
Ferrer
Kyowa Kirin
LEO Pharma
Merck
MSD
Novartis
Nordic Pharma
Organon
Pfizer
Sanofi
Zambon

Coverage. Frequency. Sales impact.

The right coverage. The right frequency. Greater incremental sales.

Reach the right HCP universe

Find the coverage needed in each area and specialty, so your team focuses on the healthcare professionals with the greatest incremental sales opportunity.

Set the right call frequency

Understand how sales respond to call frequency by area and HCP specialty. Tune how often your team engages each segment.

Maximize incremental sales

Evaluate coverage and frequency together, then build an HCP call plan that directs your commercial effort toward incremental sales.

Inside the platform

From execution data to an optimized HCP call plan

Connect activities with sales outcomes, identify the right coverage–frequency mix, and refine the plan with your field team.

  1. Connect execution with sales

    Bring your activity and sales data together to understand the coverage–frequency response by area and HCP specialty. Compare your current plan with a recommended scenario.

    Coverage and frequency choices linked to expected incremental sales

    How execution connects to sales

    HCP universe coverage

    How many HCPs you reach

    Call frequency

    How often you call

    Sales response

    By area & HCP specialty

    Optimize your HCP call plan

    • Tune universe coverage
    • Adjust call frequency

    Maximize incremental sales

  2. Find account opportunities

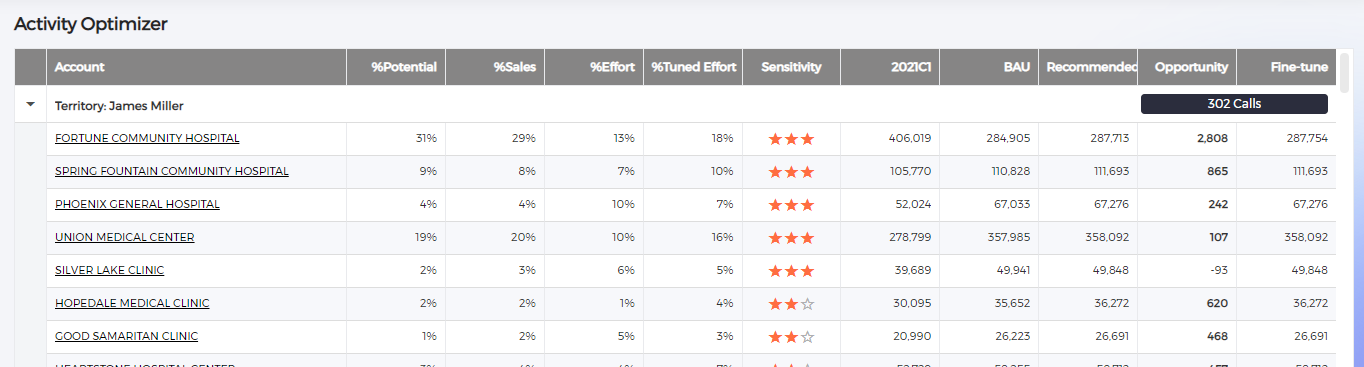
    Prioritise accounts by promotional sensitivity and growth opportunity, so teams can focus their effort where it can make a difference.

    Account priorities for each territory

    Activity Optimizer · Account opportunities
    Activity Optimizer · Account opportunities. Compare account potential, current effort and recommended activity.

    Compare account potential, current effort and recommended activity.

    View full-size screen (opens in a new tab)
  3. Tune coverage and call frequency

    Compare recommended HCP coverage and call frequencies by area, specialty, channel and tier. Review the sales opportunity behind each allocation.

    An HCP call plan designed to maximize incremental sales

    Activity Optimizer · Promotional mix
    Activity Optimizer · Promotional mix. Compare baseline, recommended and fine-tuned activity across channels.

    Compare baseline, recommended and fine-tuned activity across channels.

    View full-size screen (opens in a new tab)
  4. Refine with field knowledge

    Let reps adjust recommendations and record reasons such as access restrictions or competition. Bring local knowledge into the plan before putting it into practice.

    A plan refined with input from the field

    Activity Optimizer · Field fine-tuning
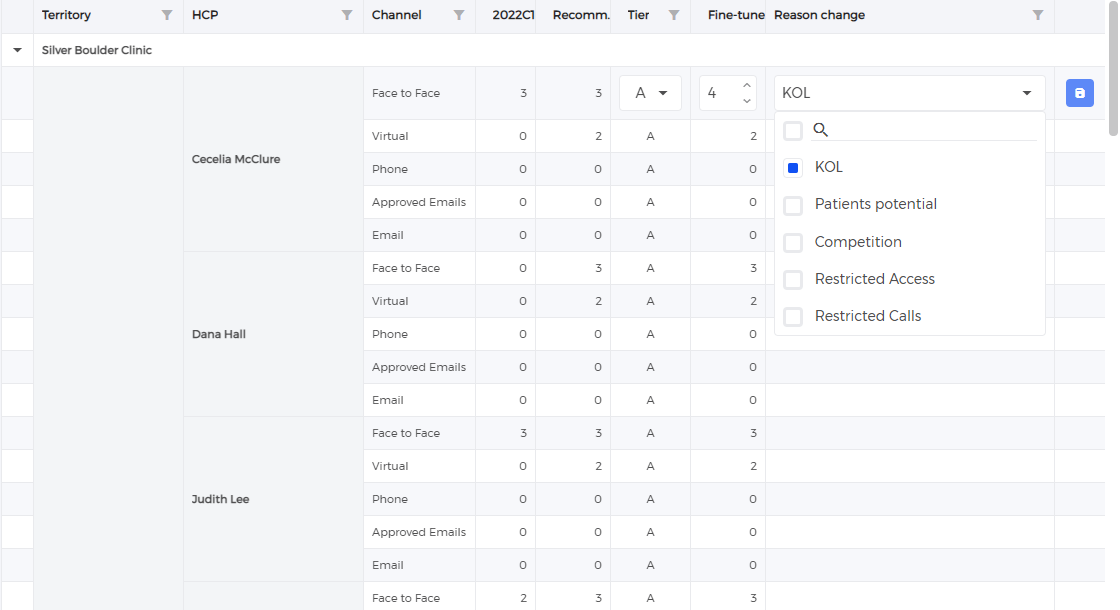
    Activity Optimizer · Field fine-tuning. Reps adjust account and HCP recommendations and record the reason for each change.

    Reps adjust account and HCP recommendations and record the reason for each change.

    View full-size screen (opens in a new tab)

Scenario controls

Set the constraints.

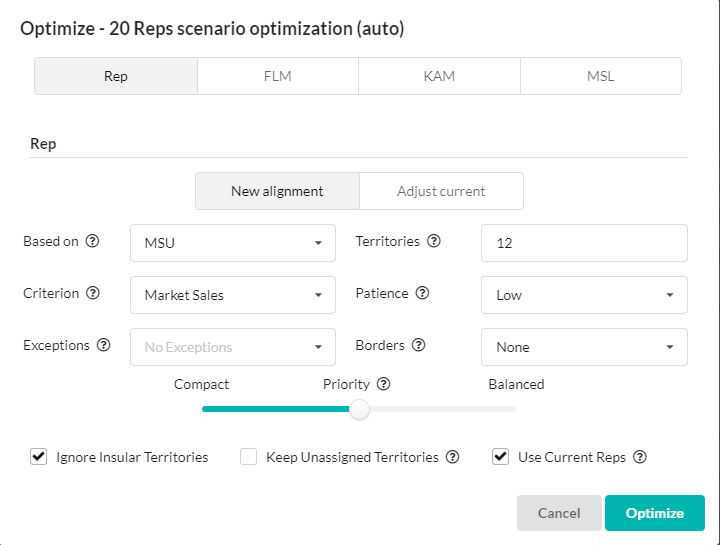
Configure territories, choose your optimisation criteria, and adjust the balance between compact territories and workload.

Territory Manager · Optimisation settings
Territory Manager · Optimisation settings. Configure territory counts, balancing criteria and optimisation constraints.

Configure territory counts, balancing criteria and optimisation constraints.

View full-size screen (opens in a new tab)

Territory Manager

Explore the alignment.

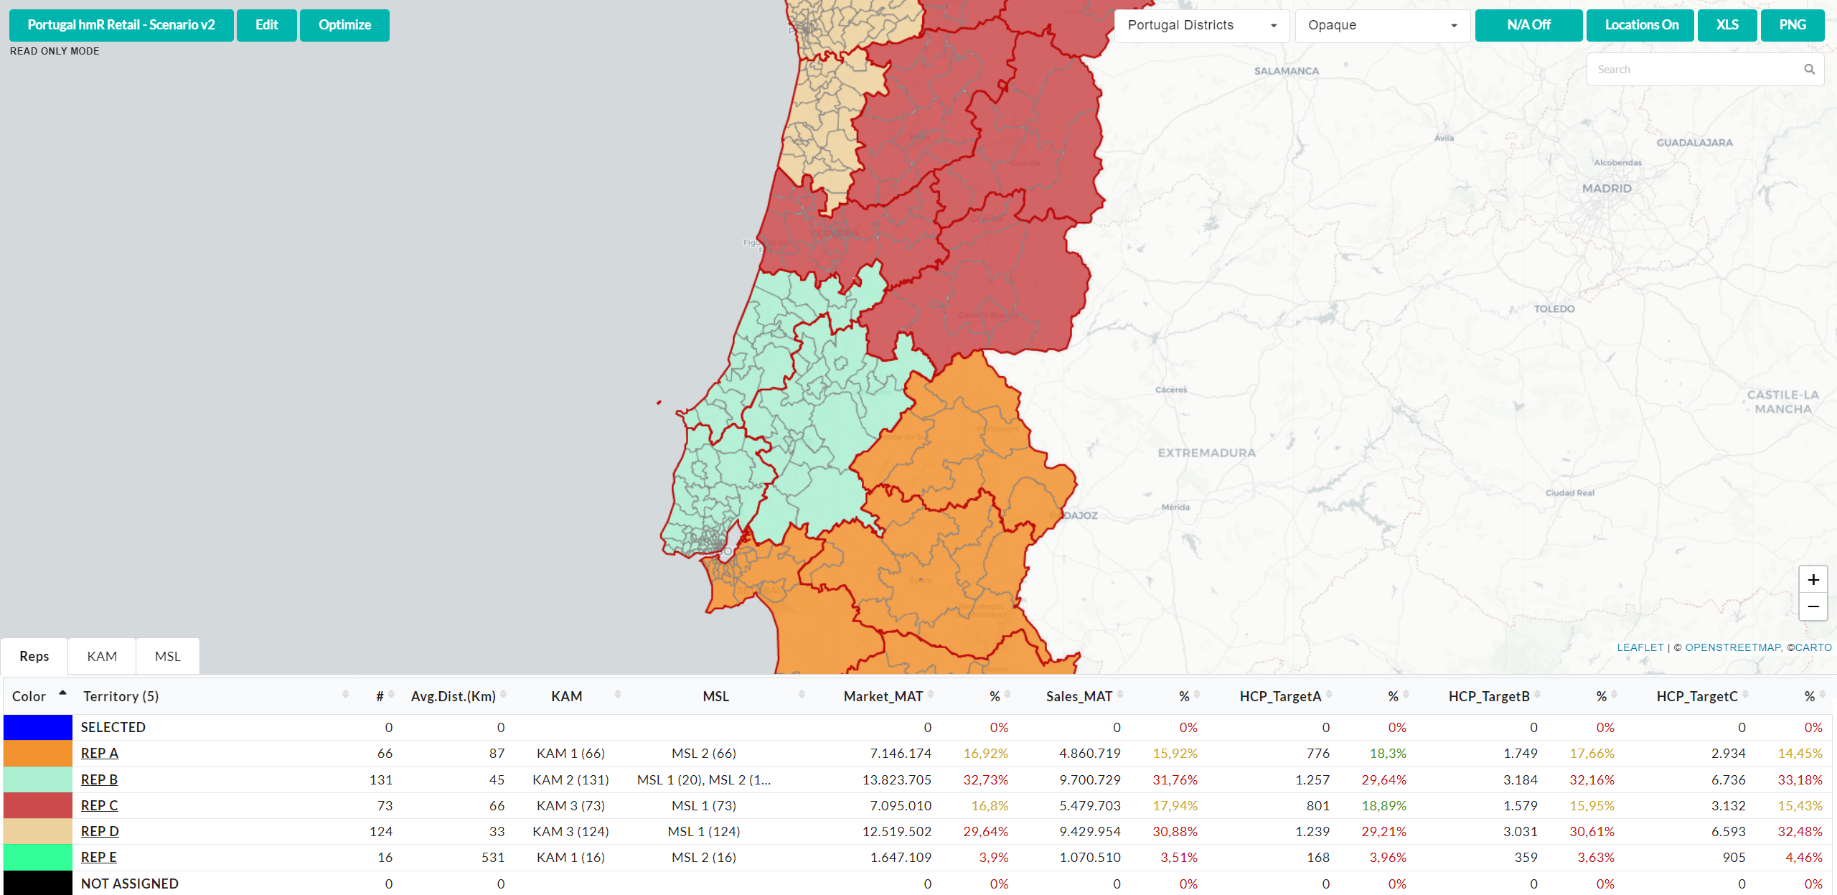
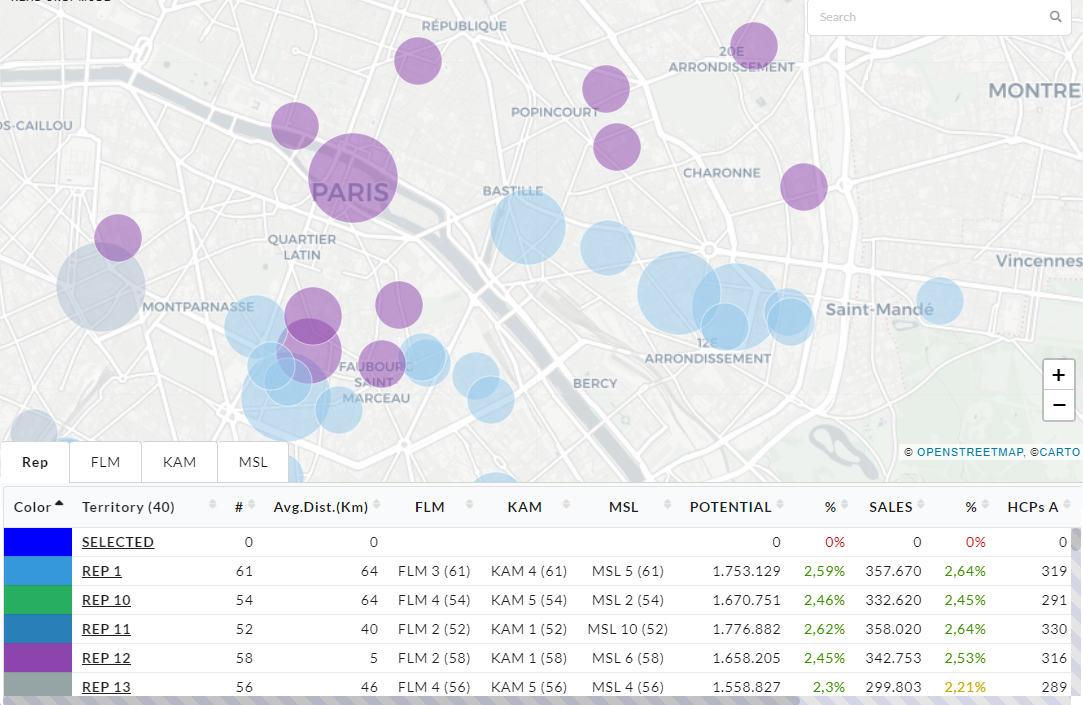
Review the territory map and compare rep workloads to explore different deployment scenarios.

Territory Manager · Explore the alignment
Territory Manager · Explore the alignment. Review the territory map alongside rep-level workload and sales metrics.

Review the territory map alongside rep-level workload and sales metrics.

View full-size screen (opens in a new tab)

Customer Success Stories

Real-world impact. Proven at scale.

All metrics reflect live deployments with pharma clients.

+77%
Penetration Index Growth

Oncology 1 · Spain

Territories using KaizenAI AI-based call plan vs. BAU across Oncology & Hematology products in Spain.

+185k€
Incremental Sales per Territory

Oncology 2 · Spain

Incremental sales uplift in Oncology 2 territories using the AI call plan vs. Business-as-usual.

+15%
Penetration Index Growth

Hematology 1 · Spain

Hematology 1 territories showed +15% penetration index growth compared to non-KaizenAI territories.

+12.7%
Portfolio Incremental Sales

Portfolio Recommender

AI-based portfolio recommender generated +12.7% incremental sales uplift vs. BAU in a multi-product deployment.

102.9%
Target Attainment

Fine-tuned scenario

Fine-tuned AI tactical plan consistently drives target attainment above 100% in deployed territories.

25%
Territories on AI Call Plan

Controlled pilot

In the Spain pilot, 25% of territories used the AI-based call plan — all outperformed BAU territories across all disease areas.

Disease Areas
Oncology & Hematology
Geography
Spain
Setup
25% territories on AI call plan vs BAU (Business-as-usual)

Penetration Index Growth & Incremental Sales — KaizenAI vs. BAU (Business-as-usual)

Onco 1

Onco 2

Hema 1

KaizenAIBAU

Platform capabilities

Explore the six platform modules

See the tools and analytical outputs behind your commercial decisions.

01 · Specialty & Omnichannel Audit

Performance Audit

Specialty & Omnichannel effectiveness assessment

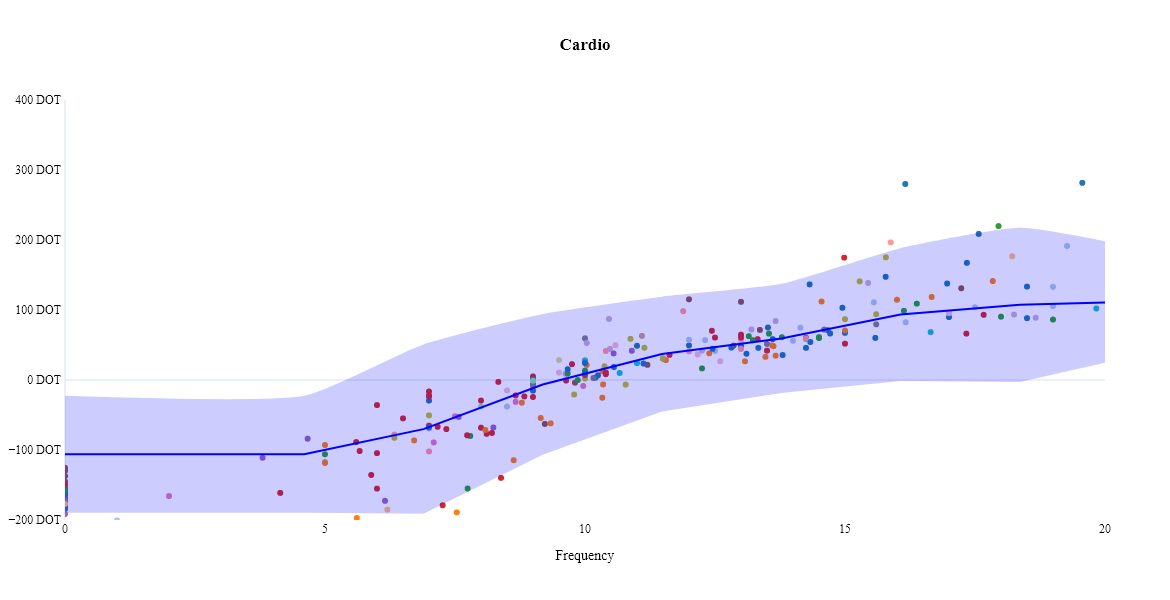
Analyse how your current omnichannel tactics — face-to-face calls, virtual, phone, approved emails, events — are driving incremental sales for each HCP specialty. Generate AI-powered productive frequency curves with 95% confidence intervals to identify the optimal call window.

Analytical example · Specialty response
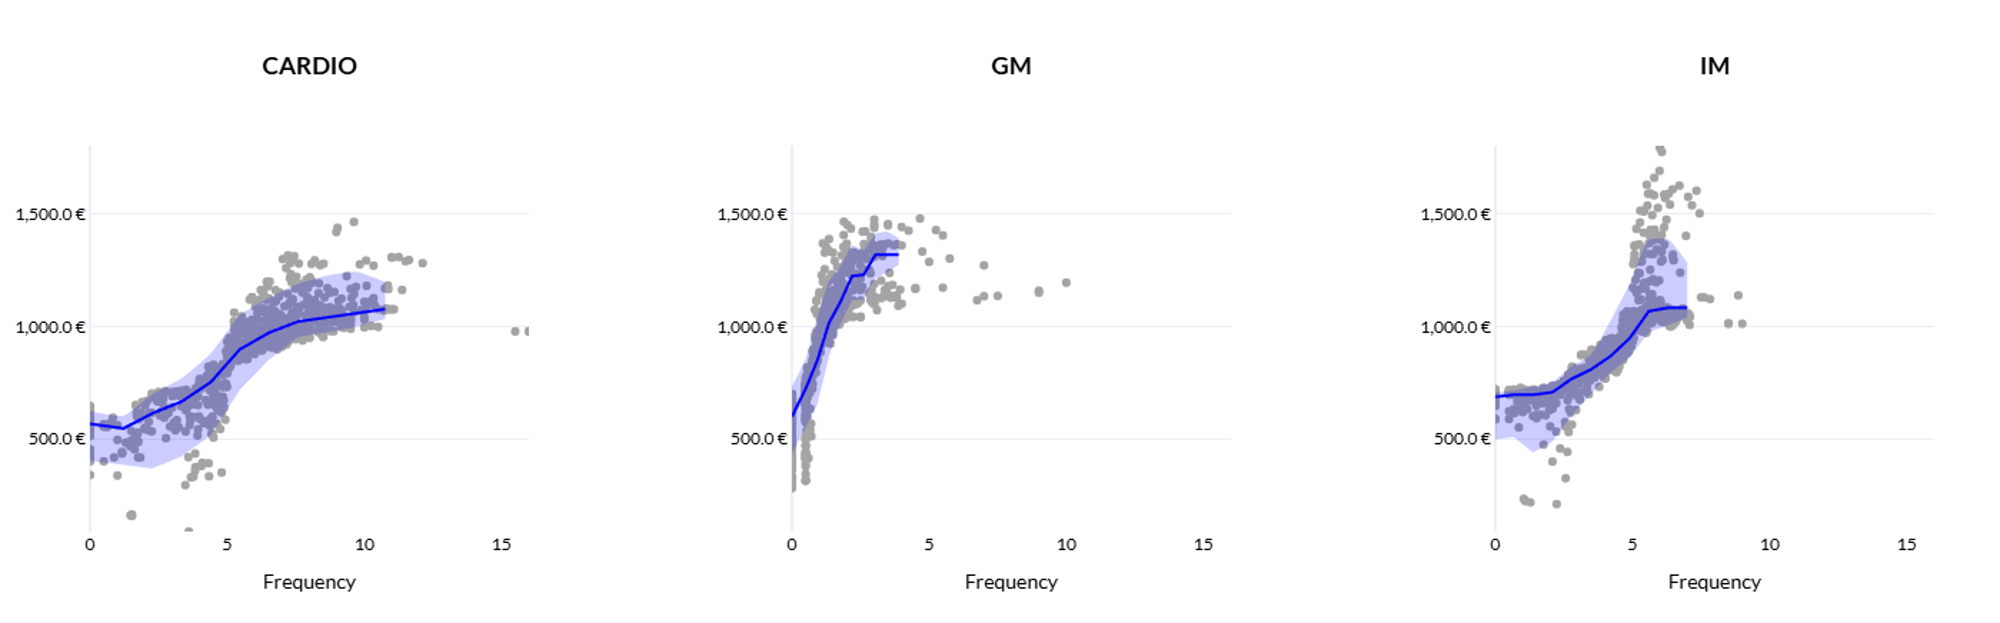
Response curves for CARDIO, GM and IM specialties, showing frequency, euro values, observations and shaded uncertainty bands.

Compare how the response to promotional frequency differs across specialties.

View full-size image (opens in a new tab)
Explore Performance Audit
  • AI-driven productive frequency curves per specialty & channel
  • Omnichannel audit: face-to-face, virtual, phone, approved email, events
  • HCP file & calls allocation audit — optimal specialty mix
  • Data cleansing → model building → performance audit workflow
Analytical example · Specialty mix
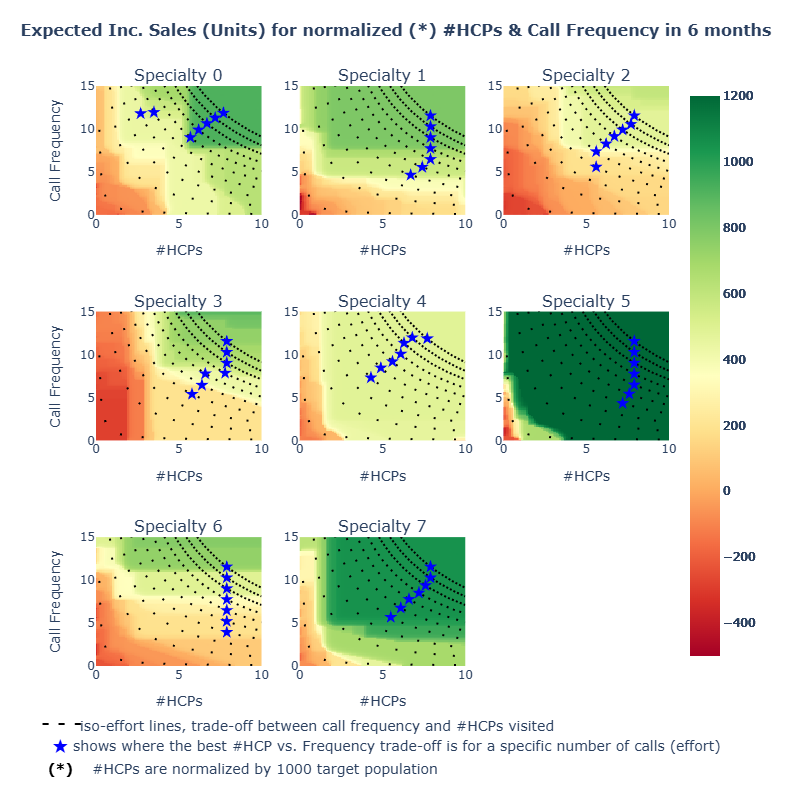
Eight specialty charts comparing expected incremental sales with normalized HCP coverage and call frequency over six months, with iso-effort lines and stars marking the best trade-offs.

Compare expected incremental sales by specialty and the trade-off between call frequency and HCP coverage over six months.

View full-size image (opens in a new tab)
02 · Activity Optimizer

AI-based Tactical Plan

From Overview to Rep Fine-Tuning

Deploy an AI-based call plan across four layers: sales projections and channel contribution overview; account opportunities ranked by promotional sensitivity; recommended promotional mix by specialty, channel and tier; and rep fine-tuning with field knowledge feeding back into the model.

Activity Optimizer · Promotional mix
Activity Optimizer · Promotional mix. Compare baseline, recommended and fine-tuned activity across channels.

Compare baseline, recommended and fine-tuned activity across channels.

View full-size screen (opens in a new tab)
Explore AI-based Tactical Plan
  • Fine-tuned, Recommended & Business-as-usual sales projection scenarios
  • Accounts ranked by promotional sensitivity & growth opportunity
  • AI explainability — SHAP-style attribution per account
  • Rep fine-tuning with reason tagging (KOL, competition, restricted access…)
Activity Optimizer · Field fine-tuning
Activity Optimizer · Field fine-tuning. Reps adjust account and HCP recommendations and record the reason for each change.

Reps adjust account and HCP recommendations and record the reason for each change.

View full-size screen (opens in a new tab)

03 · Territory Manager

Field Force Sizing & Deployment

Optimal headcount and territory alignment

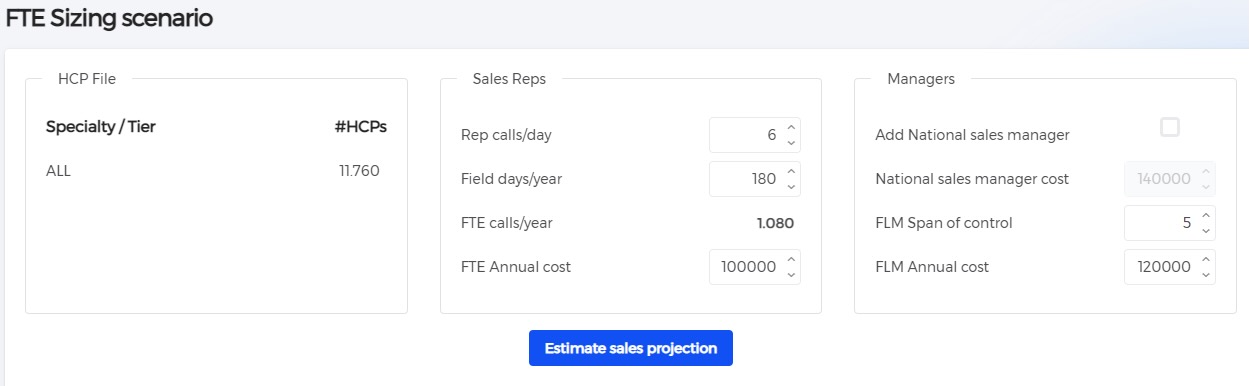
Use AI-driven promotional saturation curves and profit optimisation to determine the ideal number of reps. Then deploy them with mathematical optimisation across IQVIA® bricks or account-based territories — balancing potential, sales, workload and travel distance across cross-functional teams (Rep, FLM, KAM, MSL).

Field Force Sizing · Scenario assumptions
Field Force Sizing · Scenario assumptions. Set field days, call capacity and staffing costs for sizing scenarios.

Set field days, call capacity and staffing costs for sizing scenarios.

View full-size screen (opens in a new tab)
Explore Field Force Sizing & Deployment
  • Sales & profit vs. FTE curve with promotional saturation modelling
  • Effort return by product — allocate resources to maximise ROI
  • Territory alignment for Spain, Germany, Portugal, Kazakhstan and more
  • Auto-optimisation with configurable constraints, borders and balance
Territory Manager · Explore the alignment
Territory Manager · Explore the alignment. Review the territory map alongside rep-level workload and sales metrics.

Review the territory map alongside rep-level workload and sales metrics.

View full-size screen (opens in a new tab)

04 · Portfolio Optimizer

Optimised Portfolio by Territory

Territory-centric product prioritisation

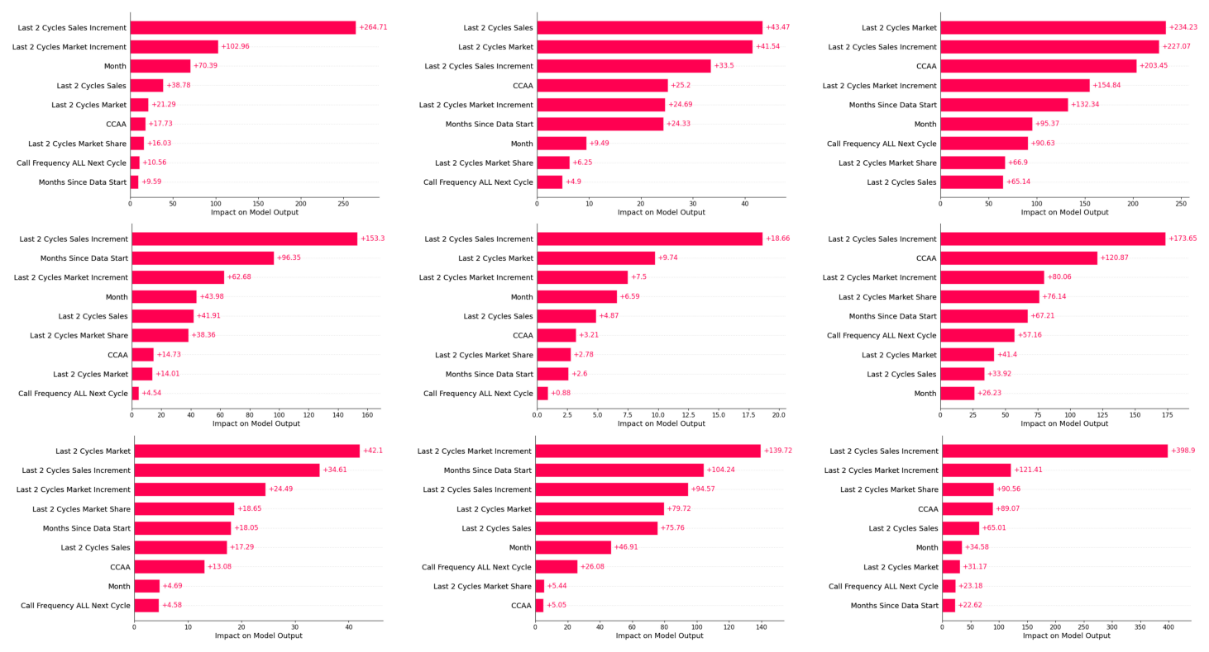
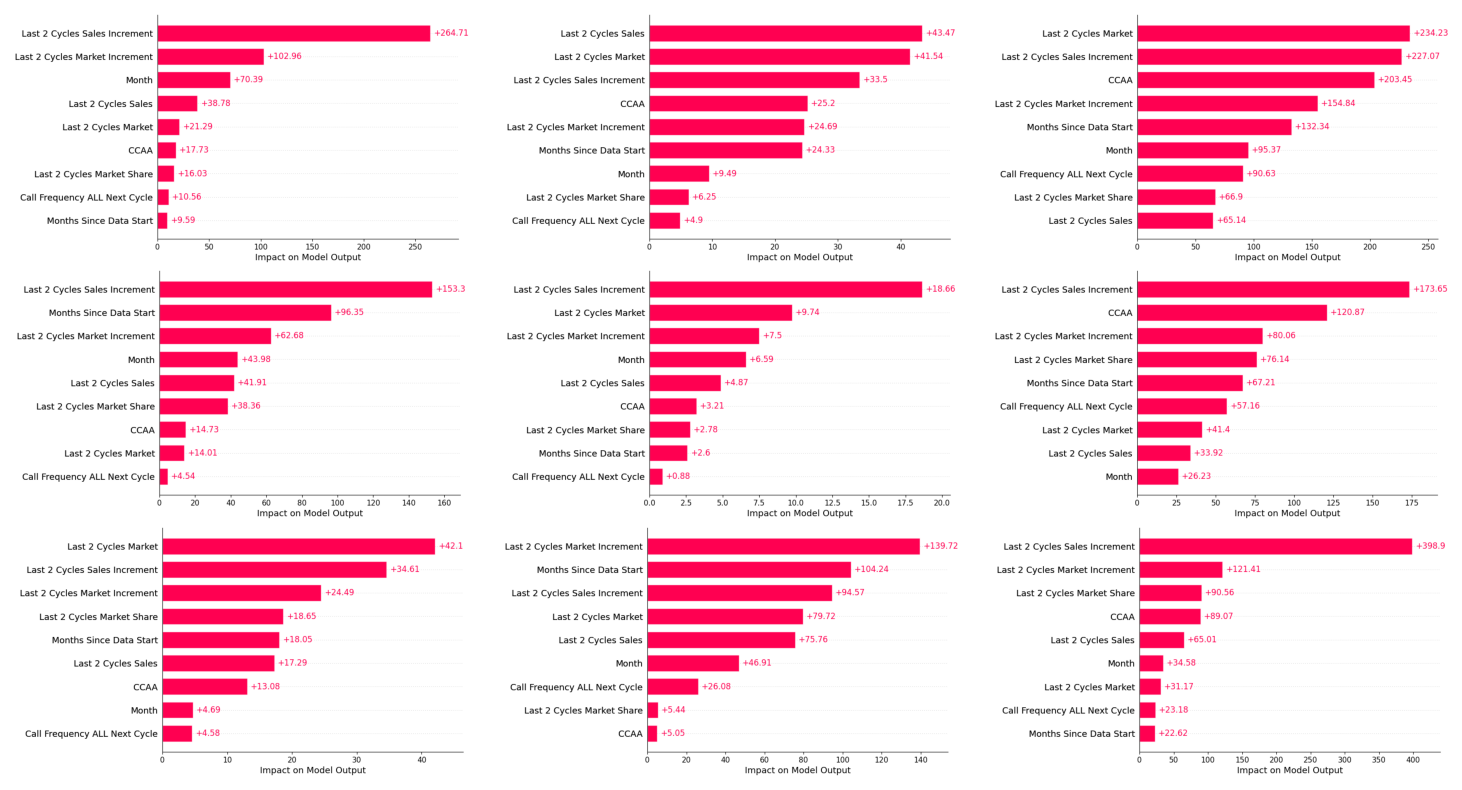
Each territory has different sales, potential and market share dynamics. KaizenAI runs product-level AI models for each promoted brand and combines them in a Portfolio Recommender that optimises call allocation across products per territory — capturing incremental growth that uniform call plans miss.

Analytical example · Portfolio model drivers
Analytical example · Portfolio model drivers. Compare the factors influencing product-level model outputs.

Compare the factors influencing product-level model outputs.

View full-size image (opens in a new tab)
Explore Optimised Portfolio by Territory
  • Individual AI model per product — variable importance per brand
  • Portfolio Recommender: optimise effort across all products simultaneously
  • Incremental sales improvement: up to +12.7% vs BAU in real deployments
  • Territory-centric portfolio action plan with customised incentive alignment

05 · Forecast & Target Setting

Forecast & Territory Target Allocation

Bottom-up AI forecasting with guardrails

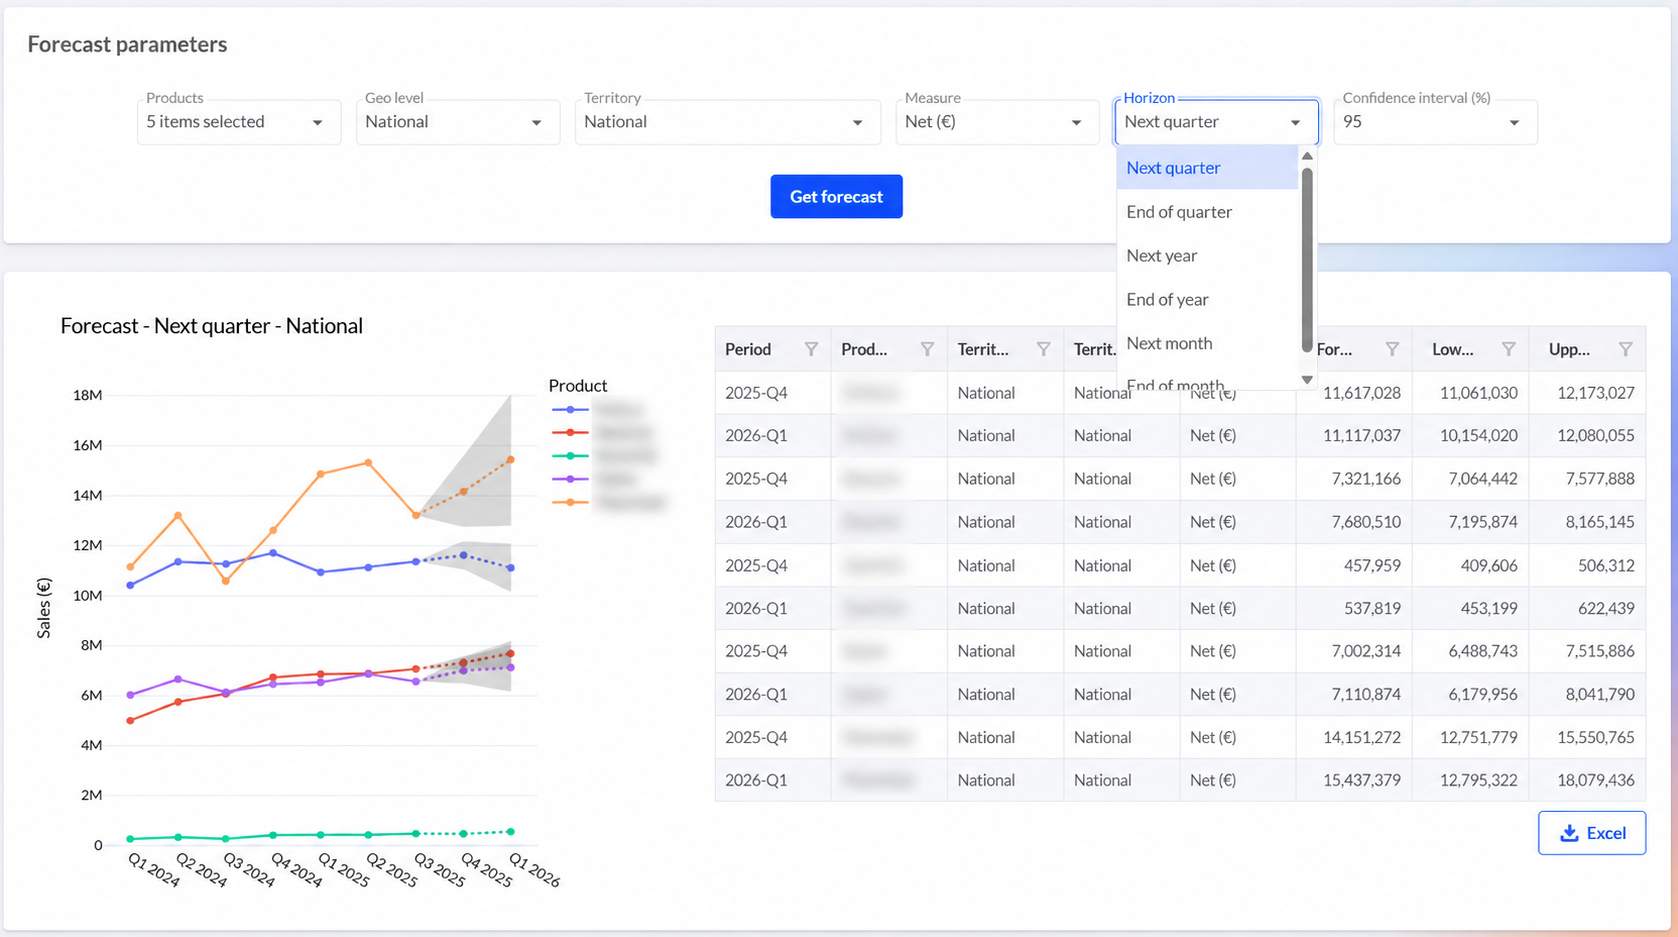
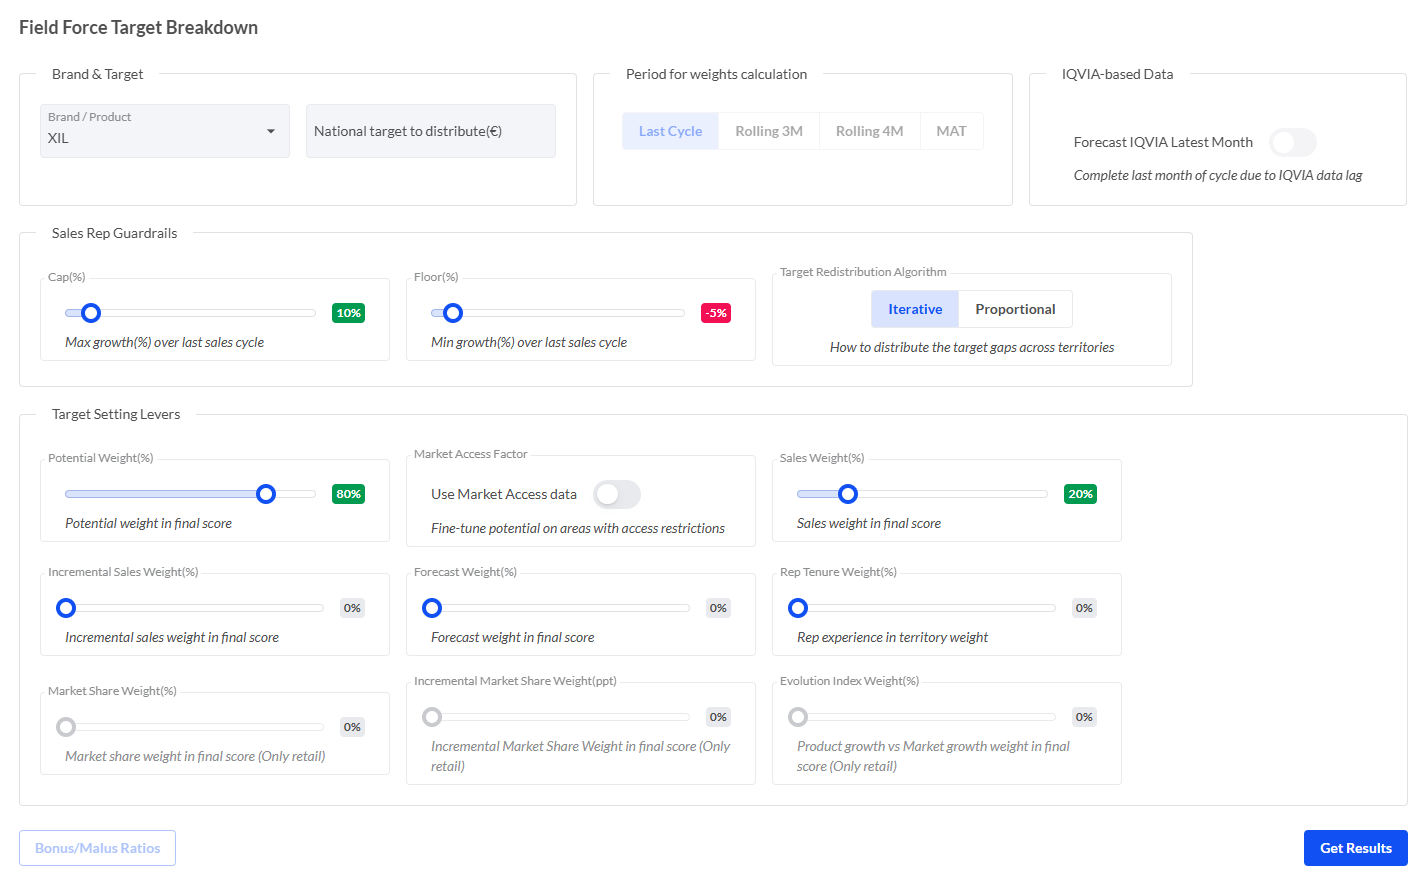
Generate bottom-up AI forecasts integrating account purchasing patterns, tactical plans and seasonal adjustments — with configurable horizons and confidence intervals. Then cascade national targets to territory level using weighted variables (potential, sales, forecast, rep tenure, market share) and guardrails to prevent unfair targets.

Forecast · Sales outlook
Forecast · Sales outlook. Configure the forecast horizon and review projected sales in the chart and results table.

Configure the forecast horizon and review projected sales in the chart and results table.

View full-size screen (opens in a new tab)
Explore Forecast & Territory Target Allocation
  • Forecast horizons: next quarter, end of quarter, next year, next month
  • Distribution weights: potential, sales, incremental growth, rep tenure, market share
  • Strategic guardrails: Cap (e.g. +10%), Floor (e.g. -5%), Rep Min Growth
  • AI-projected expected sales vs. established targets for direct comparison
Target Allocation · Weights and guardrails
Target Allocation · Weights and guardrails. Set national targets, allocation weights and territory growth guardrails.

Set national targets, allocation weights and territory growth guardrails.

View full-size screen (opens in a new tab)

06 · Data Governance

Data Governance

Integrated data management & quality

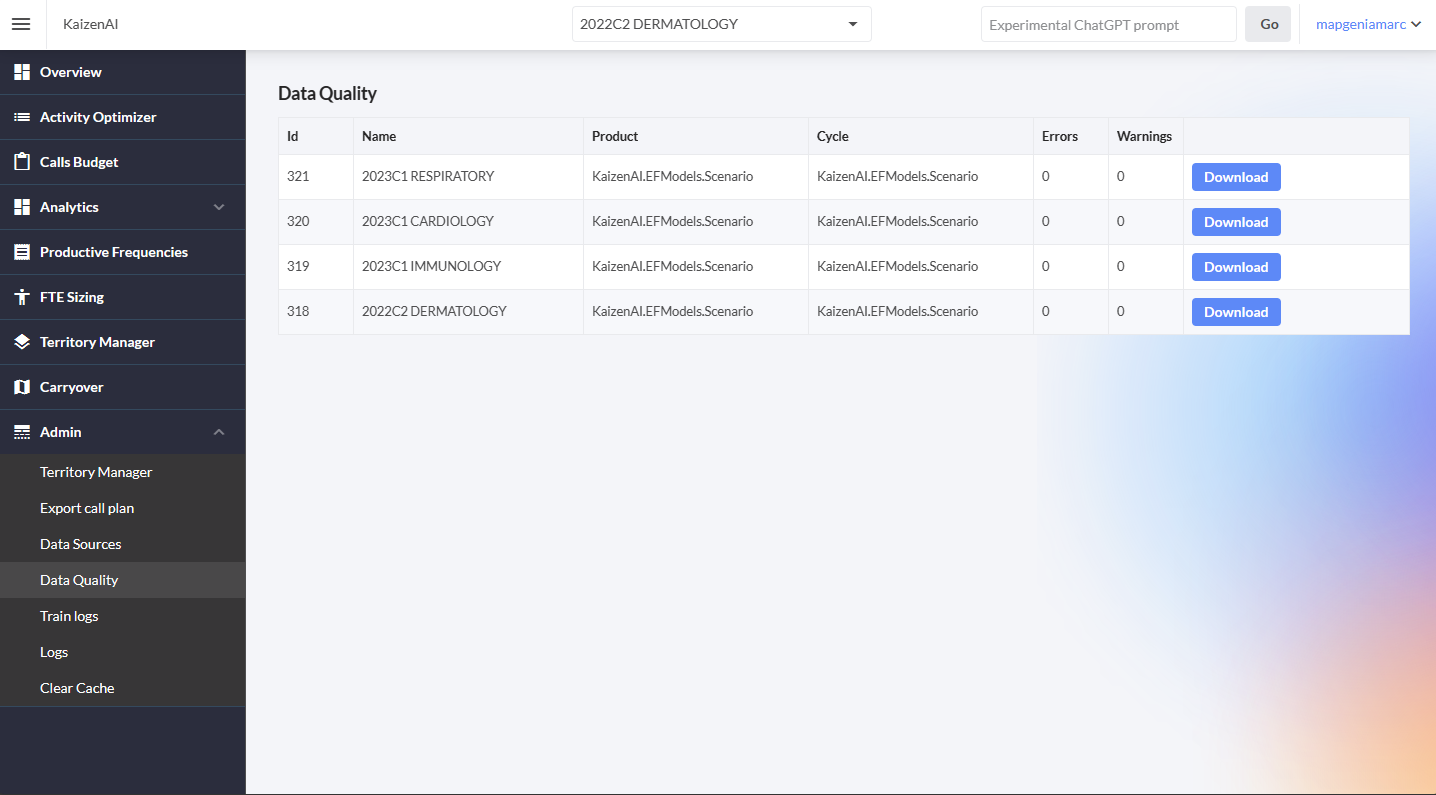
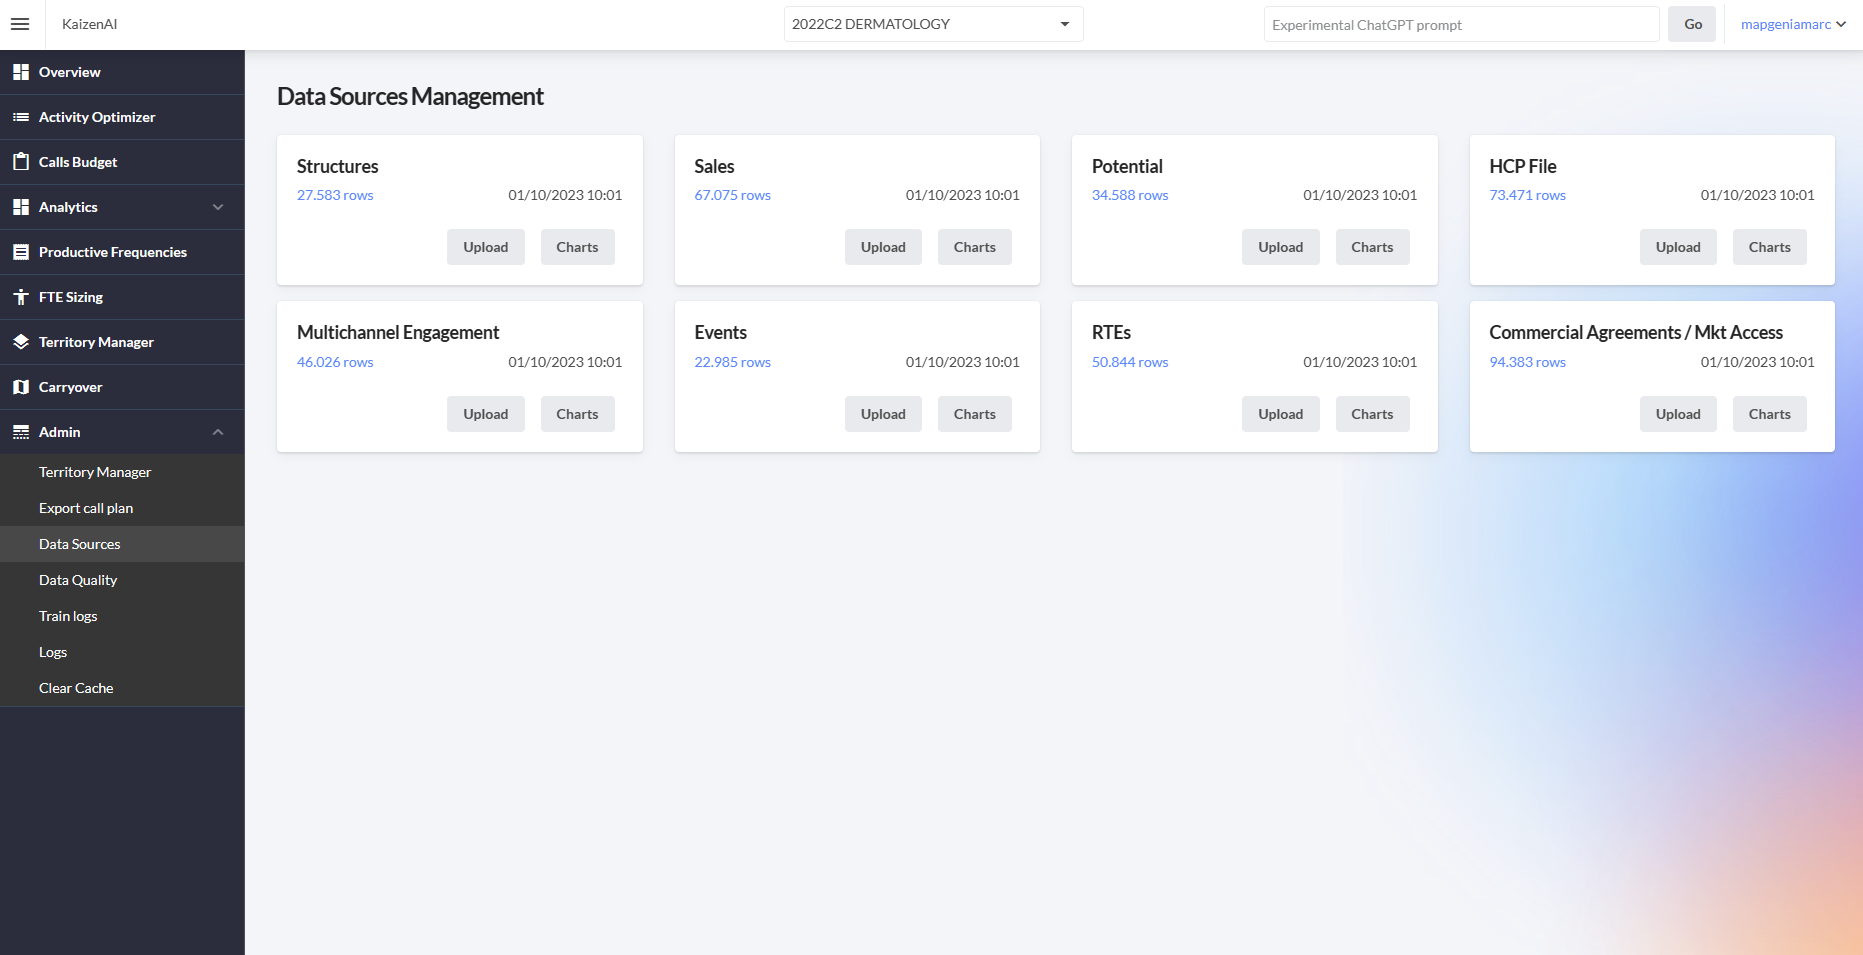
A centralised data management UI lets you upload, inspect and validate all commercial data sources — structures, sales, potential, HCP file, multichannel engagement, events, RTEs and commercial agreements. Over 120 critical errors and warning checks based on pharma business knowledge surface data quality issues before they affect your models.

Data Governance · Quality checks
Data Governance · Quality checks. Review data errors and warnings before running your planning models.

Review data errors and warnings before running your planning models.

View full-size screen (opens in a new tab)
Explore Data Governance
  • >120 critical errors & warnings based on commercial pharma knowledge
  • Data sources: structures, sales, potential, HCP file, calls, events, RTEs
  • Web upload, WebDAV & automated SFTP ingestion (e.g. SAP daily sales)
  • Quality checks delivered via Email & Microsoft Teams Webhook
Data Governance · Commercial data inputs
Data Governance · Commercial data inputs. Manage platform data inputs, including commercial agreements. This screen shows data sources, not agreement-impact results.

Manage platform data inputs, including commercial agreements. This screen shows data sources, not agreement-impact results.

View full-size screen (opens in a new tab)

Use Cases

Explore your commercial questions

Eleven decisions KaizenAI can support. Explore the approach, benefits, and data requirements behind each one.

#1 · Field Force Sizing

Field Force Sizing

How will field force resizing impact sales and market share?

Field Force Sizing · Scenario assumptions
Field Force Sizing · Scenario assumptions. Set field days, call capacity and staffing costs for sizing scenarios.

Set field days, call capacity and staffing costs for sizing scenarios.

View full-size screen (opens in a new tab)
Explore Field Force Sizing

Effort-Sales Model using Sales + CRM data to generate promotional saturation curves and profit optimisation for each FTE scenario.

  • Decision-making is data-driven (mid & long-term sales impact)
  • Minimises assumptions
  • Based on defined constraints (calls/year, rep/manager costs)

Data requirements and limitations

  • Needs historical sales data (not valid on product launches)
  • Does not extrapolate (frequencies / new specialties)

#2 · Territory Alignment

Territory Alignment

Where should we place reps in an equitable way to achieve a more efficient outcome?

Territory Manager · Account-based alignment
Territory Manager · Account-based alignment. Explore accounts and rep metrics on the territory map.

Explore accounts and rep metrics on the territory map.

View full-size screen (opens in a new tab)
Explore Territory Alignment

Evaluate account and brick-level sensitivity and workload, then optimize deployment to maximize balance while minimizing disruption and travel.

  • Multivariate: sensitivity, sales, potential, workload, addresses
  • Mathematical optimisation with trade-offs between variables
  • Account disruption constrains fully configurable

Data requirements and limitations

  • Use of subjective restrictions

#3 · Omnichannel Audit

Specialty Promotional Sensitivity

Which HCP specialties are most sensitive to promoting a product?

Analytical example · Specialty sensitivity
Analytical example · Specialty sensitivity. Explore call frequency and response for a specialty.

Explore call frequency and response for a specialty.

View full-size image (opens in a new tab)
Explore Specialty Promotional Sensitivity

Use Effort-Sales modeling to identify productive frequency windows and refine frequency ranges by HCP specialty and tier.

  • Fact-based decision-making rather than only intuition
  • Visualise the elasticity of call frequencies and other tactics
  • Allows you to adjust frequency ranges by Specialty & Tier

Data requirements and limitations

  • Needs large number of calls per specialty, channel, etc.
  • The model ignores qualitative criteria (e.g., access restrictions)

#4 · Activity Optimizer

Promotional Mix — AI

How should we allocate promotional effort to maximise results?

Activity Optimizer · Promotional mix
Activity Optimizer · Promotional mix. Compare baseline, recommended and fine-tuned activity across channels.

Compare baseline, recommended and fine-tuned activity across channels.

View full-size screen (opens in a new tab)
Explore Promotional Mix — AI

Promotional sensitivity curve per covered HCP target combined with effort return by product chart enables data-driven optimal frequency assignment per tactic and channel.

  • Data-driven resource allocation
  • Optimal productive frequencies for activity assignment for each product

Data requirements and limitations

  • Needs historical data to train the promotional sensitivity model
  • Not valid for product launches

#5 · AI Tactical Plan

Sensitivity-Driven Call Plan

How to optimise call plans to maximise sales growth and attain the sales target?

Activity Optimizer · Field fine-tuning
Activity Optimizer · Field fine-tuning. Reps adjust account and HCP recommendations and record the reason for each change.

Reps adjust account and HCP recommendations and record the reason for each change.

View full-size screen (opens in a new tab)
Explore Sensitivity-Driven Call Plan

Recommended call plan per account based on promotional sensitivity, growth opportunity and call capacity per rep/cycle — with rep fine-tuning and reason tagging.

  • Increases sales and makes reps realise that reporting well in CRM benefits them
  • Breaks targeting inertia (e.g., A: 8 calls/cycle; B: 4 calls/cycle)
  • Engages reps through HCP fine-tuning & target achievement

Data requirements and limitations

  • FF resistance to change vs. tier-based classical model (preset call frequencies)

#6 · Omnichannel Audit

Omnichannel Strategy

How to distribute the promotional effort in customer engagement channels?

Activity Optimizer · Planning overview
Activity Optimizer · Planning overview. Sales projections, channel contribution and recommended activity compared with the previous cycle.

Sales projections, channel contribution and recommended activity compared with the previous cycle.

View full-size screen (opens in a new tab)
Explore Omnichannel Strategy

Channel-Result Execution Model: Constrained optimization to model sales impact, refine call frequency per rep, and drive targeted HCP-level engagement.

  • Model impact in sales by channel → Data-driven
  • Inference + optimisation with #calls per rep and cycle
  • Engage the sales force at the HCP level → Ownership

Data requirements and limitations

  • Inertia and field force change management
  • Needs post-Covid historical data to train the models

#7 · Portfolio Optimizer

Portfolio per Territory

Which products and incentives should be prioritized by territory to maximize consolidated sales results?

Analytical example · Territory model drivers
Analytical example · Territory model drivers. Compare model drivers supporting territory portfolio analysis.

Compare model drivers supporting territory portfolio analysis.

View full-size image (opens in a new tab)
Explore Portfolio per Territory

Analyse market share divergence across products and territories. Use opportunity detection maps and variable importance charts to customise the action plan per territory.

  • Captures each product's growth opportunity
  • Customises the action plan based on the situation per territory

Data requirements and limitations

  • Sales targets and incentives model needs to be customised accordingly

#8 · Hospital Analytics

Commercial Agreements Impact

What is the commercial agreements impact by region, territory & hospital?

Data Governance · Commercial data inputs
Data Governance · Commercial data inputs. Manage platform data inputs, including commercial agreements. This screen shows data sources, not agreement-impact results.

Manage platform data inputs, including commercial agreements. This screen shows data sources, not agreement-impact results.

View full-size screen (opens in a new tab)
Explore Commercial Agreements Impact

AI model analyses discount on sale impact to quantify to what extent pricing agreements are decisive in the sale and the sensitivity of each account.

  • Know to what extent the discount is decisive in the sale and its sensitivity in each account

Data requirements and limitations

  • Needs historical data from hospital agreements with a similar profile to measure future impact

#9 · Activity Optimizer

Sales Turnaround

How do we make a sales boost to capture a greater business opportunity?

Activity Optimizer · Account opportunities
Activity Optimizer · Account opportunities. Compare account potential, current effort and recommended activity.

Compare account potential, current effort and recommended activity.

View full-size screen (opens in a new tab)
Explore Sales Turnaround

Optimize sizing, deployment, and call plans: scale effort toward saturation and focus on high-growth, sensitive accounts.

  • Data-driven resource allocation
  • Optimal productive frequencies to allocate tactics and channels for each hospital or territory

Data requirements and limitations

  • Limited in extrapolation for radical changes

#10 · Portfolio Analytics

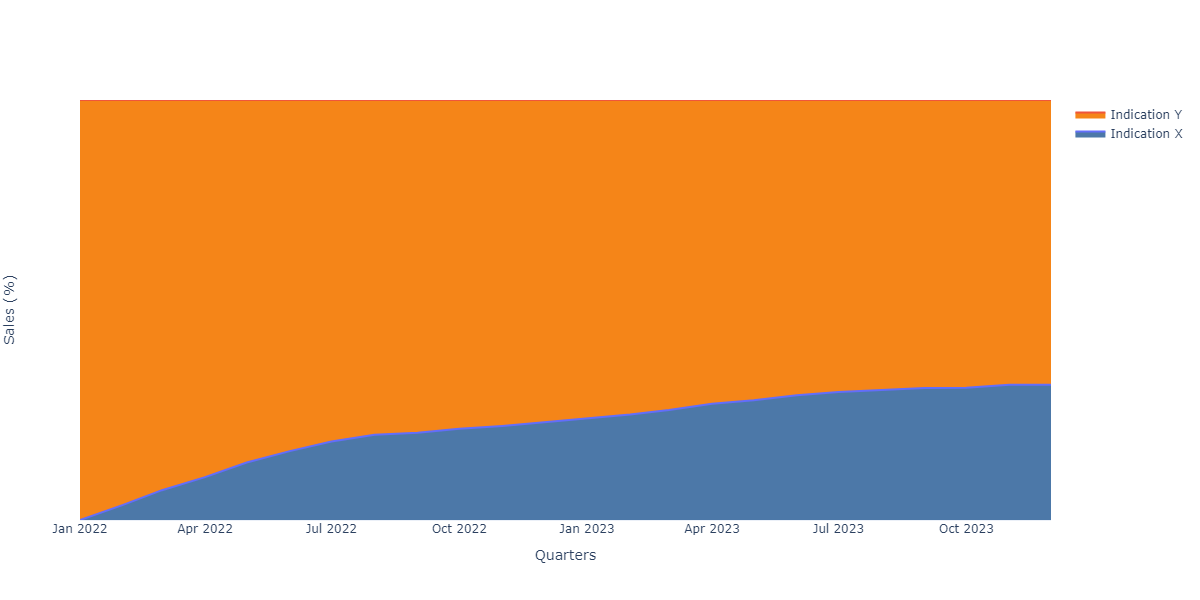
Sales per Indication

Can we quantify contribution by indication and team for multi-indication brands?

Analytical example · Sales per indication
Analytical example · Sales per indication. Explore the sales contribution of each indication over time.

Explore the sales contribution of each indication over time.

View full-size image (opens in a new tab)
Explore Sales per Indication

AI models can estimate territory-level incremental sales by indication. Visualize indication balance across territories using penetration bubble charts.

  • Data-based understanding of contribution per indication and field team
  • Identification of effectiveness of different tactics per indication

Data requirements and limitations

  • Accuracy may decrease with increased granularity

#11 · Account Intelligence

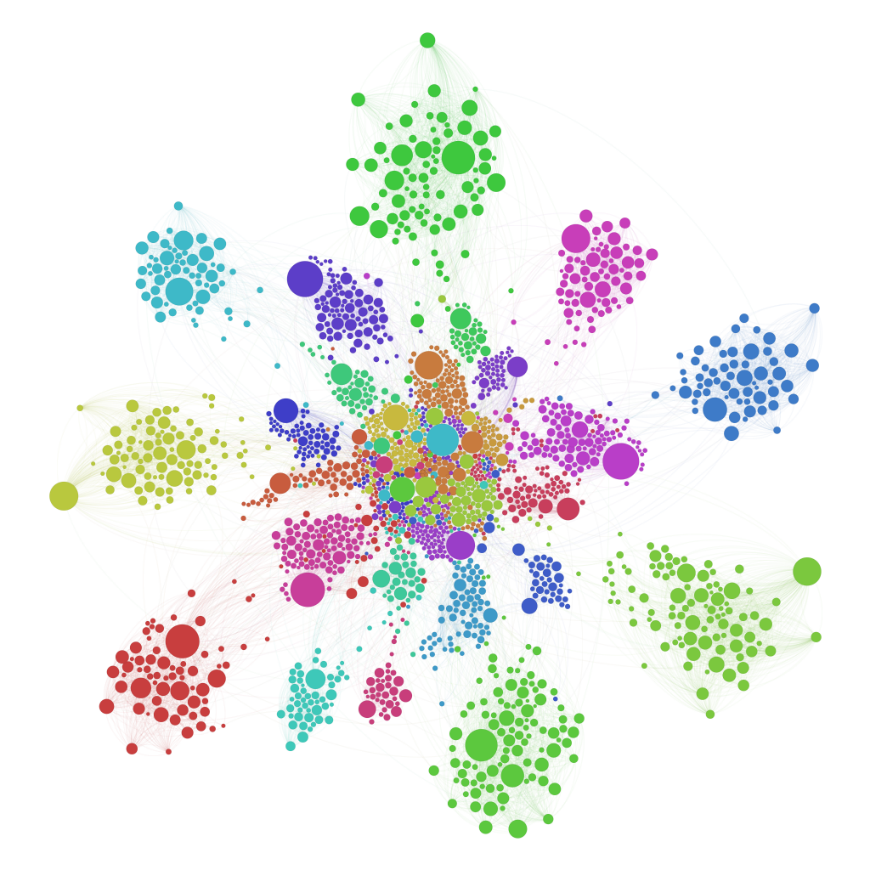
Account Segmentation

How can we segment our centres to focus and adapt the account action plans?

Analytical example · Account segmentation
Analytical example · Account segmentation. Visualise account clusters to inform differentiated action plans.

Visualise account clusters to inform differentiated action plans.

View full-size image (opens in a new tab)
Explore Account Segmentation

AI clustering allows account archetyping and micro-segmentation based on multiple variables: potential, access type, regional authorisation, promotional sensitivity, #HCPs by specialty.

  • Account archetyping and micro-segmentation on multiple variables
  • Customise action plans based on account archetypes

Data requirements and limitations

  • Needs historical data with a diversity of hospital profiles to detect clusters

Who we are

Pharma experience. Applied machine learning.

We bring over 15 years of experience developing and deploying analytics platforms for commercial pharma. Our team combines pharma domain knowledge with machine learning expertise to support commercial planning—from global Top 20 companies to mid-size pharma teams.

Getting started

A clear starting point for your team

How would we get started?

We agree the scope and timing after reviewing your data and requirements. A pilot could focus on one country or franchise: review data readiness, define evaluation measures, compare recommendations with the existing plan, then decide on rollout.

What data do you need?

Sales, account or HCP data, and activity history provide the starting point. Multichannel engagement and potential data can add context. Data-quality checks flag gaps and inconsistencies before modelling.

How can we provide our data?

The platform supports web upload, WebDAV, and automated SFTP ingestion, including daily sales feeds. We review your available exports and data structure during scoping. Data-quality alerts can be delivered by email or Microsoft Teams webhook.

How are data-handling requirements addressed?

We review your data-handling and access requirements during scoping, including the needs of your commercial teams and IT stakeholders.

Can reps adjust the recommendations?

Reps can review recommended activity and refine it using field knowledge. Change reasons, such as access restrictions or competition, record the context behind an adjustment.

How would we evaluate a pilot?

We would agree the comparison, measurement period, and success measures before starting. The review would consider the recommendations alongside the existing plan and feedback from the field team.

Something else? Ask us directly →

Ready to get started?

Start improving your commercial execution today

See how KaizenAI could support your commercial planning. Tell us your area of interest and we’ll tailor the demo.

No commitment — free initial demo

Data requirements reviewed together

Scope and timing agreed with you